




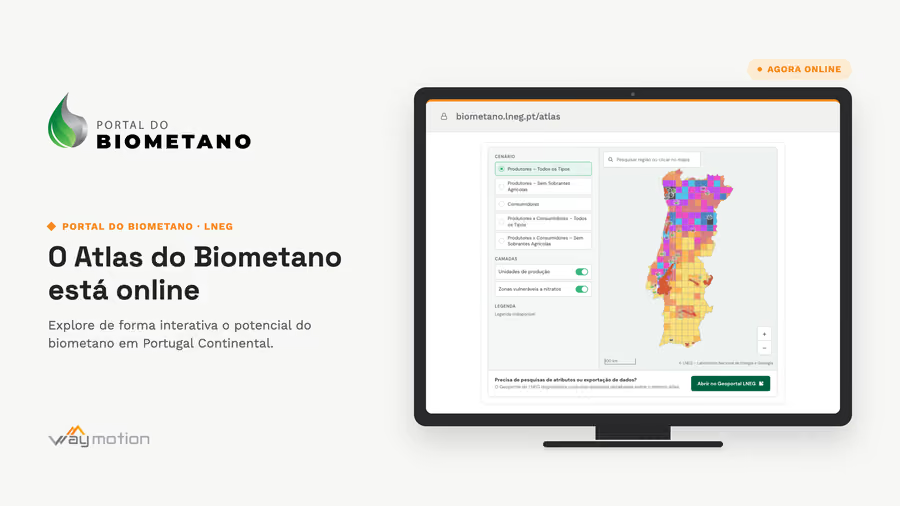
Waymotion built, together with LNEG, the viewer that opens the Biomethane Atlas for mainland Portugal to the public — where the feedstock is, where the demand is, and where a production plant makes sense.
The new Biomethane Atlas viewer from the National Laboratory for Energy and Geology (LNEG) is now online. Anyone can explore Portugal’s biomethane potential interactively and reach the data behind it.
The Atlas is one part of the Portal do Biometano, LNEG’s platform for Portugal’s Biomethane Action Plan 2024-2040 and its implementation. Until now it was a study. It becomes a tool people use.
The purpose of the Atlas
Siting a biomethane plant is a territorial decision before it is an engineering one. It depends on there being enough feedstock nearby, on someone to consume the gas produced, and on grid infrastructure to connect to.
On the supply side, it georeferences the potential biogas sources — municipal landfills, wastewater treatment plants, agri-industry and agricultural waste — with estimated volumes in m³/h, classified into four bands from very low to high. On the demand side, it maps the industrial consumers with the highest thermal intensity, such as ceramics and glass, transport sector hubs, natural gas grid injection points, and off-grid gas units.
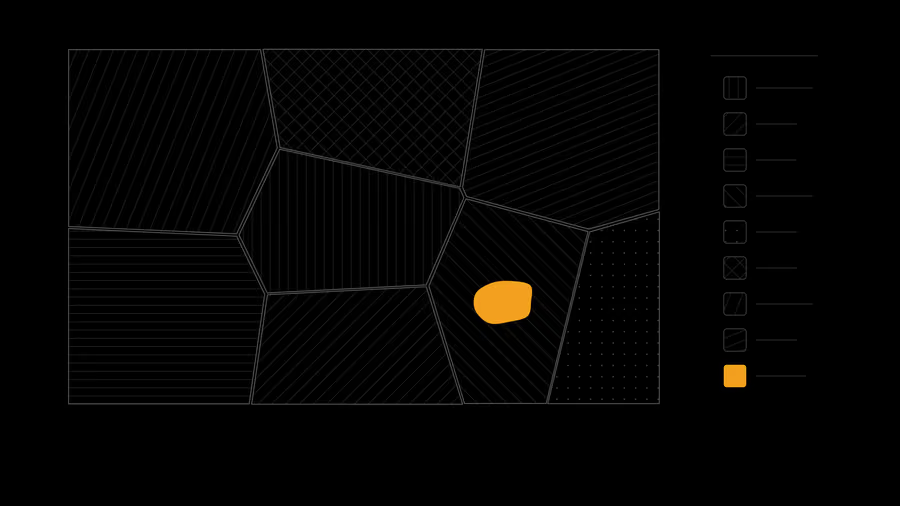
The territory is divided into a 20 × 20 km² grid, 278 cells in total, covering mainland Portugal.
Five scenarios
Rather than forcing everything into a single map, the viewer lets you switch between scenarios:
- Producers, across all source types or excluding agricultural surplus;
- Consumers, on their own;
- Producers × Consumers, the overlay that reveals where supply and demand coincide — again in both variants, with and without agricultural surplus.
The distinction between scenarios with and without agricultural surplus is not a detail: it is the difference between theoretical potential and potential that can realistically be mobilised in the short term, because collecting dispersed agricultural residues carries a logistics burden of its own that does not always pay off.
Two context layers can be switched on over these scenarios: existing production units, and nitrate-vulnerable zones — the latter relevant because that is where recovering livestock effluent carries the greatest environmental benefit.
Open data
The information reaches the viewer through an integration with the Open Data of LNEG’s Geoportal.
The methodology documentation behind the calculations is also available from the Atlas, for anyone who wants to understand how the figures were derived before relying on them.
Why the Atlas matters
Making public information accessible, visual and transparent is what separates a report from an instrument for decisions. The Biomethane Atlas decides nothing for anyone — but it lets a developer, a municipality, a researcher or a regulator start the conversation looking at the same data.
That is the contribution we set out to make: supporting the energy transition and the growth of renewable gases in Portugal with tools anyone can open.
Our thanks to the LNEG team for their collaboration throughout the project, and for creating the data the Atlas makes available.
The Biomethane Atlas can be explored at biometano.lneg.pt/atlas.