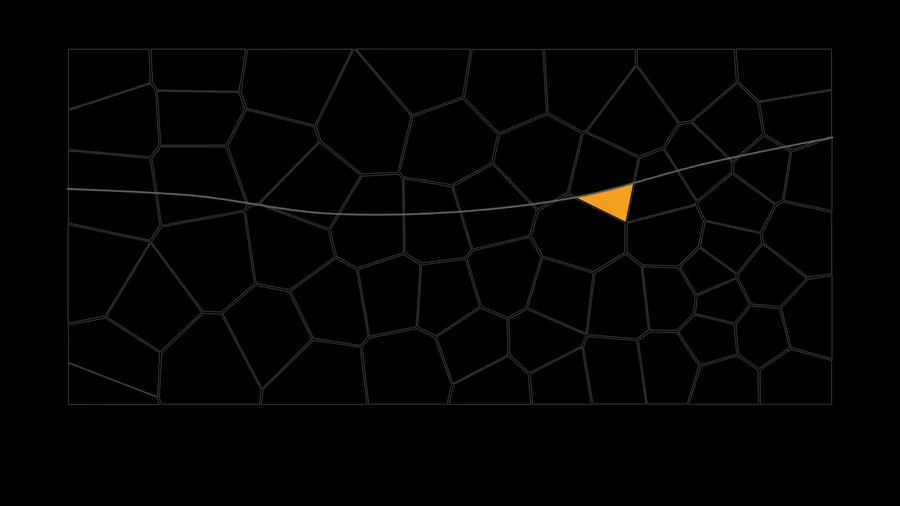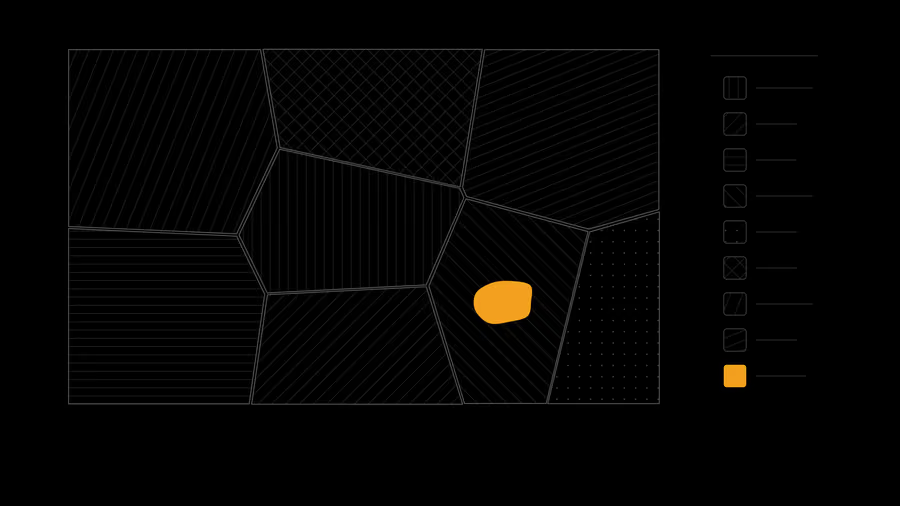





The web interface and analytical features of the Portuguese eENVplus pilot, combining land-use mapping, administrative boundaries and demographic data.
The context
Understanding how a territory is transformed means relating information produced at different moments and drawn from a variety of sources.
The work
In 2015, within the European eENVplus project, Waymotion developed for the Direção-Geral do Território (DGT, the Portuguese directorate-general for territory) the web interface and the analytical and reporting features of the Portuguese pilot Urban Ecological Land Use Planning.
The application brought together the Carta de Uso e Ocupação do Solo (COS, the national land-use map), CORINE Land Cover, the administrative boundaries of the Carta Administrativa Oficial de Portugal (CAOP) and demographic data published by INE. It allowed different moments of land use to be compared and spatial and graphical results to be consulted by region, municipality or parish.
The pilot focused on the evolution of artificialised areas in the municipality of Loures, including their relationship with the resident population and the calculation of artificialised area per inhabitant.
What it left behind
Waymotion’s work centred on turning geographic and statistical data into comparable territorial indicators and on an accessible user experience, supporting the reading of land-use change and the communication of environmental information.